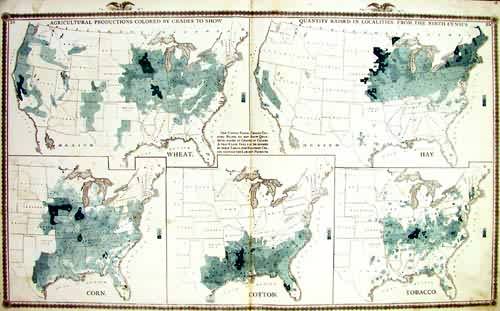
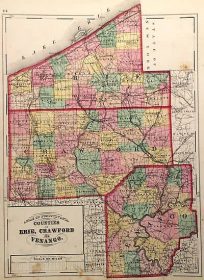
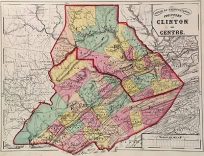
Agricultural Production Colored By Grades to Show Quantity Raised in Localities.
In stock
This map is from A.T. Andreas” Illustrated Historical Atlas of the State of Iowa, printed in 1875. This map shows the amount of hay, corn, wheat, tobacco, cotton and corn grown at the time of the ninth cencus on five seperate maps.
Size: 26 x 16 inches
Condition: Good
Map Maker: A.T. Andreas
Coloring: Lithographic Coloring
Year: 1875
Condition: Good
Map Maker: A.T. Andreas
Coloring: Lithographic Coloring
Year: 1875
In stock


